Imagine a heat source shaped like the letter A. As heat spreads, its sharp edges soften. The two legs and the gap in the middle become harder to pick out. If we only see the temperature later on, can we work out what the source looked like?
That is the question behind my summer research at HKU. Calculating how heat spreads is the forward problem. Starting with temperature measurements and trying to recover the source is the inverse problem: we are working backwards.
What interests me is not just whether the recovered values are close to the original ones. I also want to know whether the shape is still there. Can we locate the source? Can we distinguish its outline and the gap inside the A? A numerical error gives one view of a reconstruction; looking at the shape gives another.
A small example
The 34-second demo follows that letter-A example. It compares a full numerical model with two smaller models, built using proper orthogonal decomposition (POD). One uses examples of letter-shaped sources; the other uses circles.
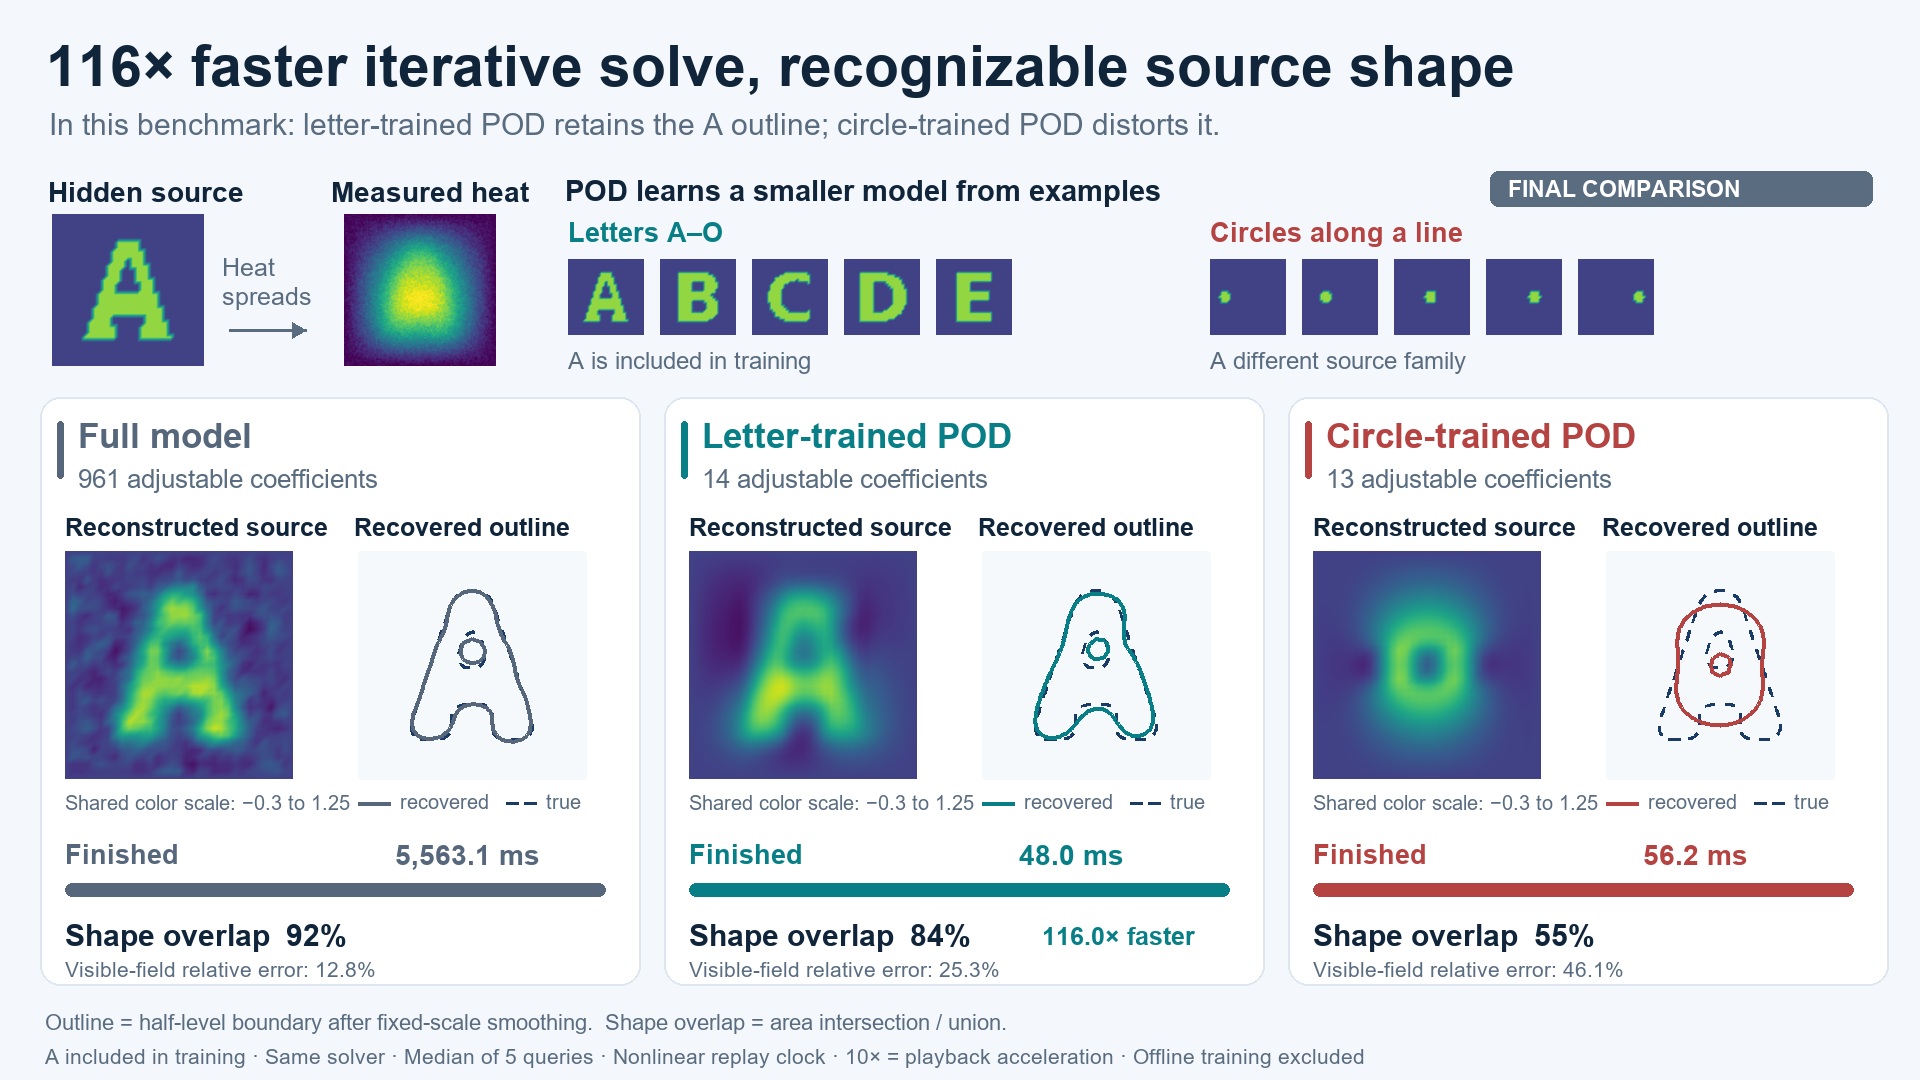
POD keeps a compact set of patterns from example solutions, so there is less to compute when solving the problem again. The choice of examples matters: a model built around circles and one built around letters have different patterns to work with. Watching the reconstructions side by side makes that difference easier to see than a table alone.
For me, this is a useful way into the research: start with a shape we recognise, watch what heat does to it, then ask what it takes to find it again.
The research overview has the demo and my summer research poster.